How to use it
The affine transform package is easy to use and ships a single configurable function that you can import:
from affine_transform import transform
Code example
A simple usage example showing some of the options looks like this:
"""
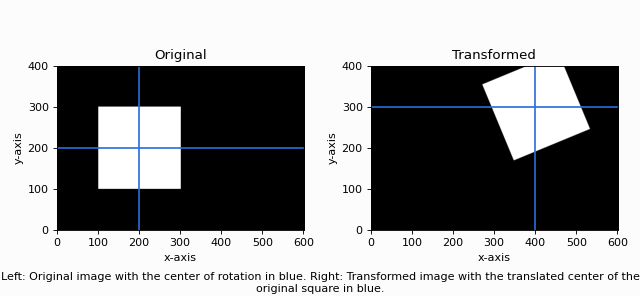
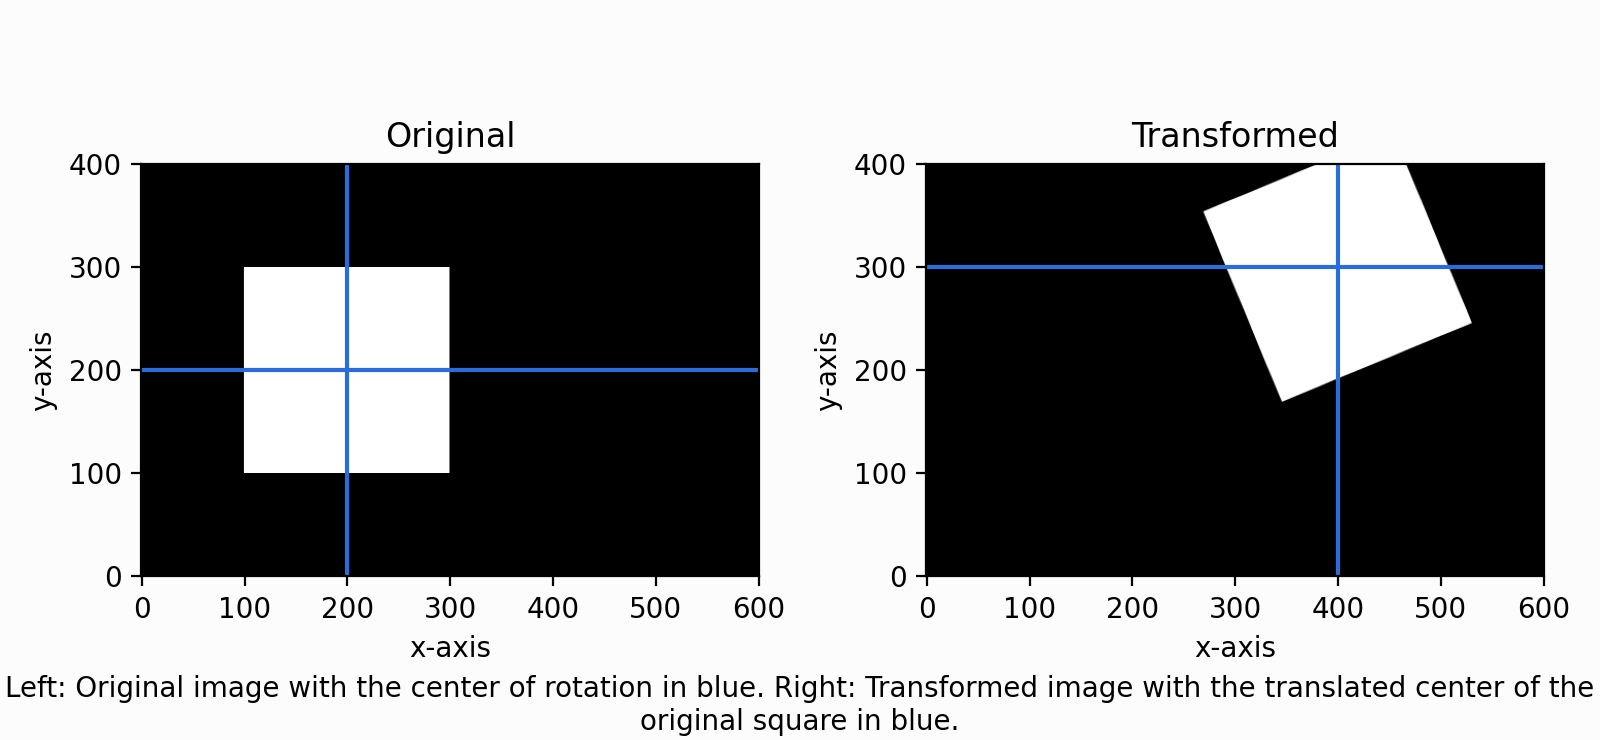
Example script showing how to rotate and translate an image.
The original image is a simple square position in the left half.
A rotation around the center of the square is applied followed by
a translation to the right and up.
This transformation process is then visualized using matplotlib
comparing the original and the transformed image side by side.
This example requires the following packages to run:
- matplotlib
- numpy
- mgen
- affine_transform
"""
import numpy as np
from affine_transform import transform
from mgen import rotation_from_angle
import matplotlib.pyplot as plt
# Create a simple white square in an image
original = np.zeros((601, 401))
original[100:300, 100:300] = 1
# Rotate by 22.5° (around the centre of the square (200,200)) and shift +200 in x and +100 in y
transformed = transform(
original, rotation_from_angle(np.pi / 8), np.array([200, 100]), origin=(200, 200)
)
#
# Matplotlib stuff only
#
plt.rcParams['savefig.facecolor'] = "#fcfcfc"
plt.figure(figsize=(8,3.7))
ax = plt.subplot(121)
plt.imshow(original.T, origin="lower", cmap="gray", vmin=0.0, vmax=1.0)
plt.plot([0, 600], [200, 200], color=(0.161, 0.427, 0.859))
plt.plot([200, 200], [0, 400], color=(0.161, 0.427, 0.859))
ax.title.set_text("Original")
plt.xlabel("x-axis")
plt.ylabel("y-axis")
plt.tight_layout()
ax = plt.subplot(122)
plt.imshow(transformed.T, origin="lower", cmap="gray", vmin=0.0, vmax=1.0)
plt.plot([0, 600], [300, 300], color=(0.161, 0.427, 0.859))
plt.plot([400, 400], [0, 400], color=(0.161, 0.427, 0.859))
ax.title.set_text("Transformed")
plt.xlabel("x-axis")
plt.ylabel("y-axis")
plt.figtext(0.5, 0.02,
"Left: Original image with the center of rotation in blue. "\
"Right: Transformed image with the translated center of the original square in blue.",
ha='center', wrap=True
)
plt.tight_layout()
plt.show()
(Source code, png, hires.png, pdf)
